Citi Bike growth and operation: Early stages overcome delays
"The first proposal for the system emerged in 2008, but environmental and technical hurdles reshaped its path toward reality."
The Citi Bike growth and operation began with a vision for urban mobility that faced significant early delays.
This guide examines the transition from initial planning to a massive expansion, covering the original 2008 proposal, the impact of natural disasters, and the expansion into surrounding areas.
How did the initial proposal shape the Citi Bike growth and own operation?

A planner sits at a desk in 2008, sketching out transit routes that would eventually transform the city streets. The project was first proposed in 2008 by the New York City Department of Transportation, aiming to provide a new layer of transit.
The original timeline faced significant setbacks before the system could reach the streets. Although the plan was set for a 2011 opening, the scheduled launch was delayed by Hurricane Sandy and various technological problems.
These early obstacles required adjustments to the deployment strategy and fleet readiness.
What were the early stages of the bike share system? Citi Bike growth and operation
In the dim morning light, a technician grips a cold metal wrench as he inspects the first citi bike docking stations.
A technician inspects a docking station as the first riders prepare to use the new fleet. The Citi Bike early stages were defined by overcoming these initial logistical hurdles to establish a reliable presence.
The delay meant the system had to adapt to a changing urban landscape before it could achieve full scale. These technical and environmental challenges shaped how the infrastructure was eventually deployed across the city.
How was the bike share NYC operation managed during expansion?
Under the bright morning sun at a crowded station, a worker wipes sweat from his brow as he moves a citi bike to balance the dock.
A worker moves a bike from one station to another to ensure availability during a busy morning. The bike share NYC operation required careful management to balance coverage with rider demand.
The system had to navigate regional complexities, such as the fact that the previous JerseyBike system used in Hoboken was incompatible with Citi Bike.
What did the Lyft acquisition Citi bike transition involve?
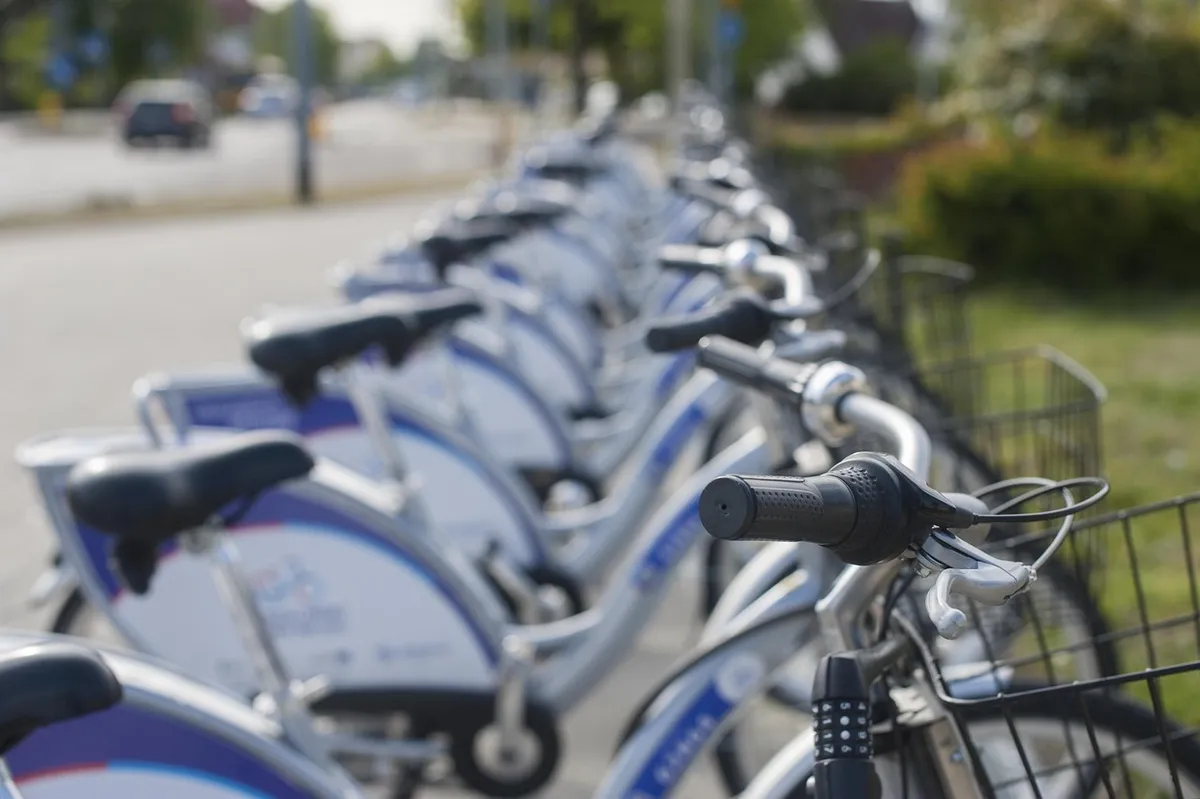
A manager reviews the operational shifts that occurred when the system underwent leadership changes. The Lyft acquisition Citi bike era represents a period of significant scaling and professionalized management.
The transition involved managing a massive user base and a growing fleet of electric and standard bicycles. This phase focused on expanding the service area and refining the user experience through better technology and density.
What were the key elements of the shared bike system study?
An analyst compares trip data to determine the efficiency of urban transit routes. A shared bike system study provides insight into how the system serves different trip lengths and speeds.
The study of these systems shows that they serve specific urban needs, such as short-distance travel. For instance, the utility bicycles average 8.3 miles per hour (13.
спорт km/h), which is slower than regular bicycles averaging 11 to 12 miles per hour (18 to 19 km/h), a factor that increases safety by lowering the risk of high-speed collisions.
How can we compare the scale of US bike-share systems?
A researcher looks at a map showing hundreds of stations across various American cities. A comparison of different systems shows the massive scale of the industry in the United States.
| Metric | Detail |
|---|---|
| 2017 US Total Trips | 35 million |
| 2017 US Systems | 100 |
According to a report by the National Association of City Transportation Officials, a total of 35 million bike-share trips took place within the United States in 2017 across 100 bike-share systems across the country, operated by eight companies.
This scale highlights the widespread adoption of shared mobility.

Wikipedia: List of bicycle-sharing systems (full) Based on the retained excerpt mentioning Toronto Parking Authority: In 2013, when Public Bike System Company acknowledged that it could not repay its $3.9 million loan to the city, the system was taken over by the Toronto Parking Authority and renamed Bike Share Toronto.
- How did the initial proposal shape the Citi Bike growth and own operation?
- What were the early stages of the bike share system?
- How was the bike share NYC operation managed during expansion?
The subject here is Citi Bike growth and operation.
Citi Bike initial setup
Related
- YikeBike urban mobility: Guide to compact transit
- Kawasaki Ninja evolution: Why mechanical shifts defined era
What challenges did the initial proposal overcome?
The first proposal faced hurdles related to both the environment and the technology required for a successful deployment. The original plan had to account for the unpredictable nature of urban environments and the technical limitations of the time.
These initial challenges informed the subsequent scaling of the service. The planners had to engineer a system robust enough to handle real-world usage patterns and unforeseen occurrences.
What was the role of the first proposal's timeline?
The initial timeline established a goal for the system's introduction into the city streets. This timeline served as the benchmark against which all subsequent delays and adaptations were measured.
The original schedule, though ambitious, required adjustments due to unforeseen external factors. These factors ultimately dictated the actual deployment schedule.
How did the system adapt to regional variances?
The bike share system needed to address differences between various operational areas. The compatibility issues encountered when integrating with other local transit services demanded specific solutions.
This adaptation was crucial for achieving broader regional coverage. The successful integration required navigating local governance structures to gain approval for expansion.
How did the first proposal address deployment realities?
The first proposal established the initial vision for urban mobility, outlining routes that would eventually serve the city. The original plan, detailed in 2008, acknowledged the inherent difficulties in deploying a novel transit option within a complex urban setting.
This initial blueprint served as the foundation upon which later operational adjustments were based.
The planners recognized that the successful implementation depended on overcoming both environmental unpredictability and technical constraints of the time.
The first proposal therefore mapped out a desired state while simultaneously accounting for the obstacles that reality would present during deployment.
What considerations guided the first proposal's scope?
The first proposal weighed the need for a scalable service against the practical limitations of the existing infrastructure. The initial scope had to be ambitious enough to warrant city-wide adoption but realistic enough to be achievable with contemporary technology.
This balance guided the early planning stages.
The planners integrated the goal of providing a new transit layer into the existing urban fabric. This meant designing a system that could coexist with, rather than replace, existing modes of transportation. The first proposal addressed this integration challenge upfront.







Comments 0